

The MATC Audit:
A Review of MATC Spending
and Its Impact on the Greater Milwaukee Area
Part 1 of a 3 Part Series
A comprehensive, self-funded review of the fiscal status of MATC has been conducted through a joint effort by the CRG Network and its affiliate the Greendale Taxpayers Group (GTG). The group consists of CPAís, pension managers, managed care specialists, legal professionals, educators, and other concerned citizens. Financial records, employment contracts, collective bargaining agreements, business plans, budgets, health care plans, pension agreements, payroll records, and expense reports were obtained from MATC using the Wisconsin Open Record Laws. After extensive analysis of this information over a 60 day period, the findings are being relayed in multiple releases to the public to educate them of the fiscal decisions made by the MATC Board of Directors and the elected government officials in the State of Wisconsin.
Wisconsinís Fiscal Status
According to a 4/12/06 national study by the Tax Foundation which ranks all State and local taxes as a percentage of per capita income, Wisconsin is tied with Nebraska for having the 6th highest tax burden in the United States1.
According to another study in March of 2005 by the
Wisconsin-based Public Policy Forum, Wisconsin has used 2 sets of
books for decades to manage its finances. One set, which uses a cash
balance method, shows a balanced budget as required under State Law.
The other set of books, using Generally Accepted Accounting
Principles (GAAP) which
are used by bond rating agencies and all US public corporations,
depicts a deficit of
almost $2 billion for Wisconsinís most current fiscal year of the
study. The report concludes that Wisconsin (using GAAP) has not had
a balanced budget since 1980. Furthermore, the bond rating agencies
of Fitch and Standard and Poors, have determined that Wisconsin,
which had one of the highest bond ratings in the nation in 1973
(AAA), and AA+ in 1995, has declined to AA- in 2004. Wisconsin is
now tied with a few other states for the second worst bond rating in
the country 2.
Bond rating depicts trends in the fiscal health of a region by comparing State and local government indebtedness and spending trends to the incomes of its residents. The severe decline in Wisconsinís bond rating exemplifies poor and irresponsible fiscal management by State and local governments who have increased growth in spending, creating structural deficits that outweigh the residentsí ability to pay.
Greater Milwaukee Economic Trends
 According to MATC financial records, the Milwaukee
and Ozaukee Counties combined have shown little to no population
growth from 1991 to 2005. In 1991, 1,032,106 lived in these
communities compared to 1,049,249 in 2005. In addition to flat
population trends, per capita income which totaled $16,271 in 1991
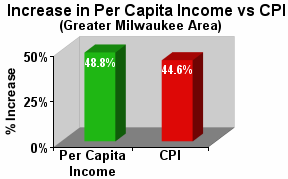
grew only 48.8% to $24,217 in 2005 over this 14 year period
3.
The 48.8% rate of increase in per capita income is nearly comparable
to the 44.6% increase in the Consumer Price Index (CPI - the most
widely recognized rate of inflation calculated by the federal
government) over that same 14 year period 4.
With virtually no growth in population and incomes growing only at
the rate of the CPI in the Greater Milwaukee Area, annual increases
in government spending above the growth in the CPI can only be
sustained by issuing more debt and further jeopardizing Wisconsinís
bond rating and/or by confiscating a larger share of residentsí
incomes each year through property and State income taxes.
MATC Physical Facts
MATC is one of 16 Wisconsin Technical Schools that comprise the Wisconsin Technical College System. MATC has approximately 55,000 students, with 13,000 being full time equivalent students. It operates out of 4 locations including the downtown Milwaukee campus (over 2 million square feet), Mequon campus (200,000 square feet), Oak Creek campus (318,500 square feet), and West Allis campus (177,000 square feet). MATC offers 200 degree, diploma, certificate, and apprentice programs and is the largest technical school in the Wisconsin system 5.
MATC Employment Profile
The Board of Directors of MATC consists of 9 appointed members who, along with administration, are responsible for preparing and approving the annual budget and negotiating union agreements with bargaining unit employees. Full and part-time faculty are represented by the American Federation of Teachers. Support staff is represented by AFSCME Local 212 and the International Brotherhood of Electrical Workers. Full-time employment/FTEís have declined from 1,484 in 98/99 to 1,412 in 06/07. There are 81 administrators, 723 other staff, and 608 teachers/specialists on staff 6. For every teacher, there are 1.3 administrators and other staff employed by MATC.
Financial Profile of MATC
 Total expenditures by MATC over the last 7 years
have grown from $203.5 million in 1999/00, to a Board-approved
budget of $308.9 million for upcoming 2006/07. In addition, MATC
owes $99.4 million in long-term debt with all but $5.2 million
coming due within the next 5 years 7.
The compound rate of total spending by MATC has increased by 6.4%
per year for this 7 year period, or 2.5 times the corresponding 2.6%
increase in the CPI 8.
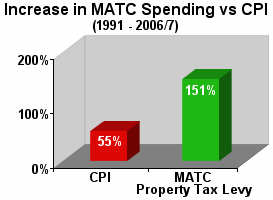
State aid, Student fees, and Property Taxes: State and Federal aid has declined from $60.8 million in 1999/00 to $55.8 million in 2006/07, requiring the student and the Greater Milwaukee Area (Milwaukee County, Ozaukee, Washington and New Berlin) property tax payer to make up the difference. Tuition and fees charged to students totaled $22.1 million in 1999/00 and increased 64% to $36.2 million in 2006/07. Over the past 10 years student enrollment (1996 to 2006/07) increased only 2%. The property tax levy in 1999/00 was $83.1 million, increasing 59.3% to $132.6 million in 2006/07. Furthermore, the total property tax levy in 1991 was only $52.7 million, compared to the tax levy budget for 2006/07 of $132.6 million increasing by 151% . The CPI had a cumulative increase for this same period (1991 to 2006/07) of only 54.9% (including estimates of a 3.6% increase in the CPI for 2006/07) 9, 10.
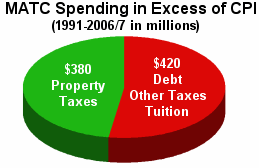
 If MATC budgets were increased in accordance with
the CPI from 1991 to 2006/07, $380 million would have been saved in
Greater Milwaukee Area property taxes, alone, over this entire
period. Furthermore, since property taxes comprise about 45% of all
revenue to fund MATC operations, approximately $800 million would
have been saved from all sources (State and Federal aid, student
fees, property taxes, etc.) had spending at MATC increased either at
the same rate as the CPI from 1991 to 2006/07, or at the rate of
growth of Milwaukee Area incomes.
Next Installment:
How our taxes dollars are spent by MATC administration and the Board
Sources and References:
1. CNNMoney.com
2. Wisconsin Policy Institute, March, 2005.
3. MATC 2000/01 and 2006/07 Activity Plan & Budget, p. 61.
4. CPI data, Federal Reserve Bank of Minnesota.
5. MATC 2006/07 Plan.
6. MATC 2000/01, 2006/07 Plan, pg. 17, 18.
7. MATC 2000/01, 2006/07 Plan pg. 30, 31 and 2006/07 Plan pg. 45.
8. CPI data, Federal Reserve Bank of Minnesota.
9. MATC 2000/01, 2006/07 Plan pg 30, 31, 55, 56.
10. CPI Data, Federal Reserve Bank of Minnesota
Copyright 2006, CRG Network